trading glossary
#
1 Tick Test/Fail
A
Absorption
Price Absorption occurs when aggressive market participants Hit the Bid or Lift the Offer on high volume, and are met with participants who “absorb” all of the orders. The effect of this price Absorption is that price moves very little or not at all.
Price Absorption can often lead to short-term reversals when the original aggressive participants give up and close their positions. See Absorption Reversal.
Absorption Reversal
An Absorption Reversal Long occurs where aggressive sellers attempt to move the market down through a key level by hitting the bid with heavy volume, but are met with buyers who “absorb” all of the selling.
This price Absorption by the buyers prevents price from continuing in its previous direction and once sellers give up and cover their positions, a move in the opposite direction can take place.
An Absorption Reversal Short is the opposite, with buyers attempting to push the price upwards at a key area, who are met with sellers absorbing the volume, therefore causing a reversal short.
Absorption generally occurs in key areas and is best observed during live market action, video or replay of market price action.
Aggressive Participants
Aggressive Participants are those traders who are willing to trade at the best available market price at that time. They are not willing to wait for a price to be filled at a specific level and end up Crossing the Market and “Lifting the Offer“ when buying and “Hitting The Bid” when selling.
The level of ‘aggressiveness’ of these participants can be measured by Volume Delta. The actions of Aggressive Participants can often provide clues to traders as to what might be likely to happen next over the short term.
See also Passive Participants, Volume Delta, Reloading.
Algo Executing
Auction Market Theory
Free resource/trial
B
Bid
BSO - Best Scale Out
C
CHVN/CLVN – Composite HVB and Composite LVN
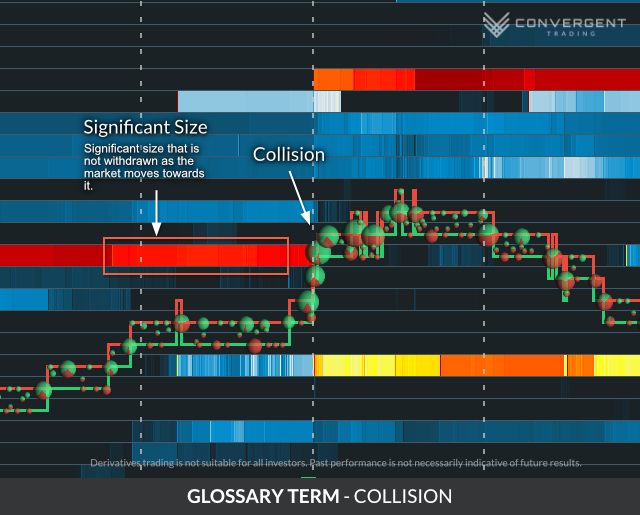
Collisions in Order Flow
Collisions refer to a high volume of orders resting in the Order Book that are met with market orders that quickly remove all of the supply. Collisions can be visually detected in an order flow tool like Bookmap.
While Collisions can often turn into Zippers or into consolidation areas, in key areas they can also drain the demand at that price level causing the opposing force to enter and drive the market in the opposite direction.
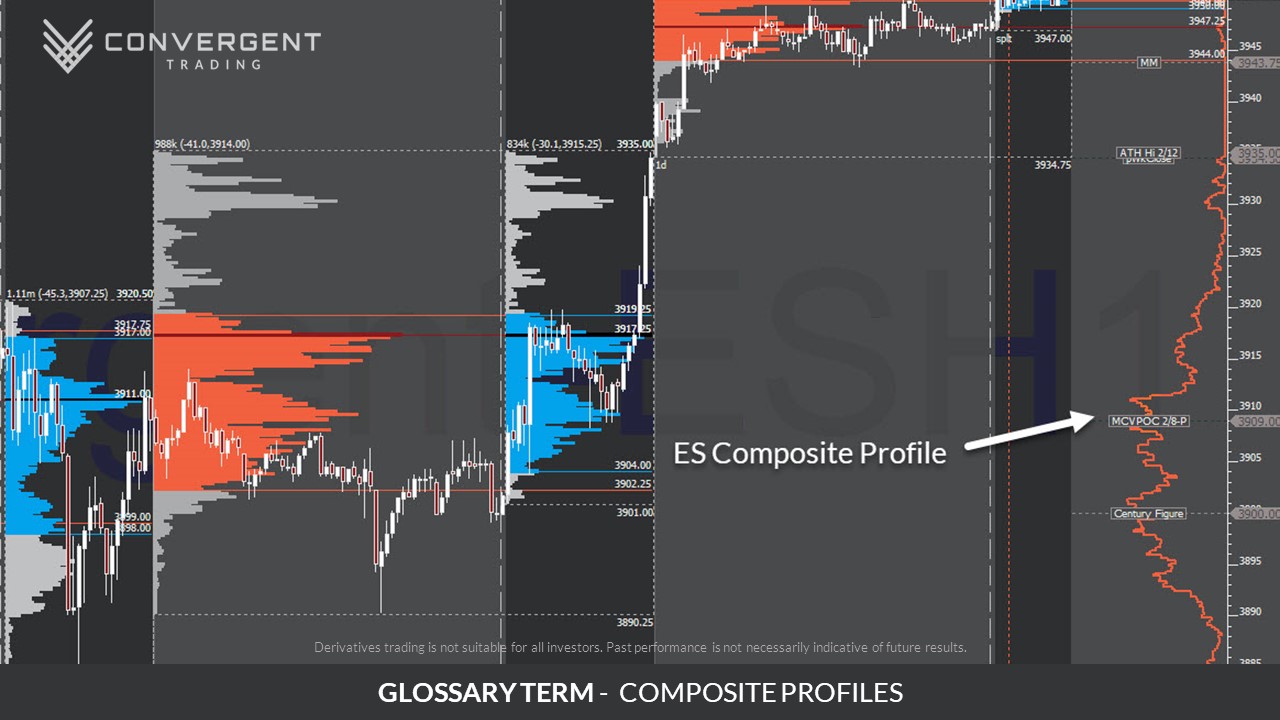
Composite Profiles
Cross the Market
In order for the market to move either up or down in price, participants must “Cross the Market”.
For price to move up, buyers must be willing to “Cross the Market” and trade at the next available Best Offer price, rather than waiting for a Limit Order at the Best Bid price to be filled. This is also known as Lifting The Offer.
Alternatively, for price to move down, sellers must be willing to “Cross the Market” and trade at the next available Best Bid price, rather than waiting for a Limit Order to be filled at the current Best Offer price. This is also known as Hitting The Bid.
Participants who are willing to “Cross the Market” and trade at the current market Bid or Ask price are known as Aggressive Participants, because they are willing to accept a worse price than they would receive by waiting for a Limit Order to be filled at a price other than market.
Cumdelta – Cumulative Delta
First see Volume Delta below. CumDelta is the sum of all of the Volume Delta values since the start of the session.
D
DGP - Day Generated Prices
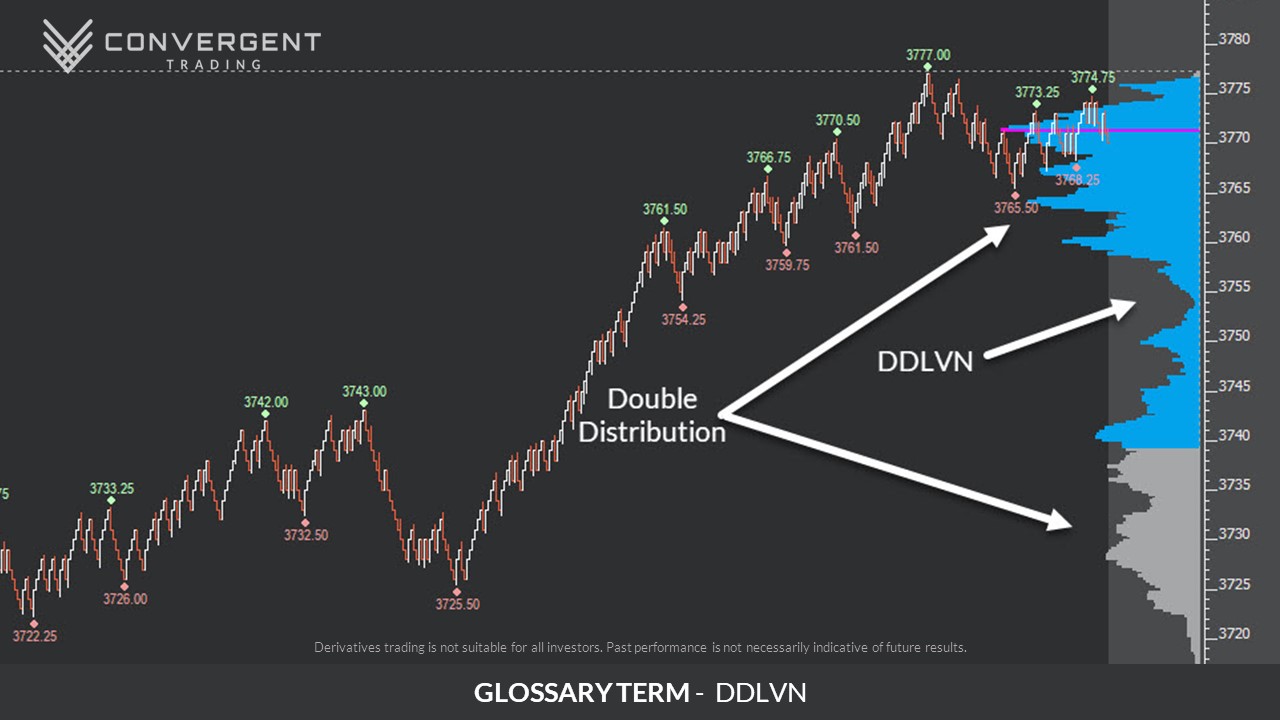
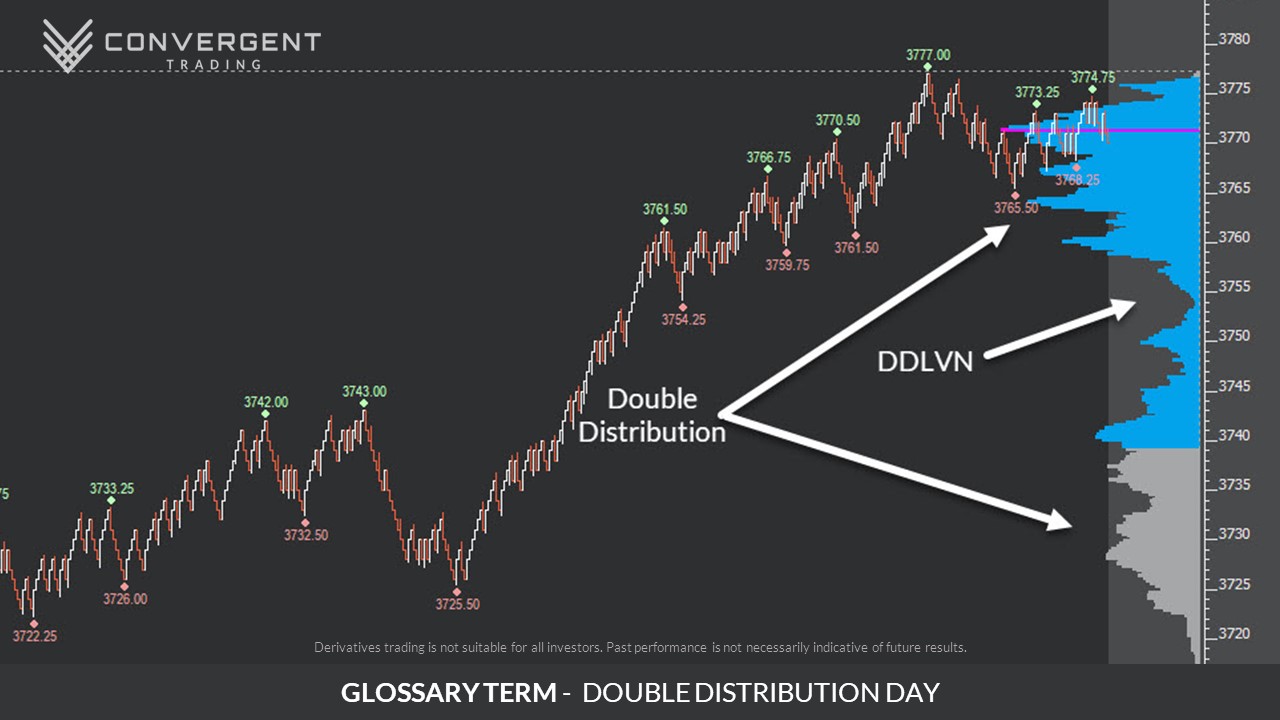
DDLVN
This is the Low Volume Node (LVN) that separates two high volume distributions on a Double Distribution Day. This is a key area to note as shown here:
DOM - Depth of Market
Double Distribution Day
This describes a day which has two acceptance distributions or High Volume Nodes (HVN) separated by a Low Volume Node (LVN).
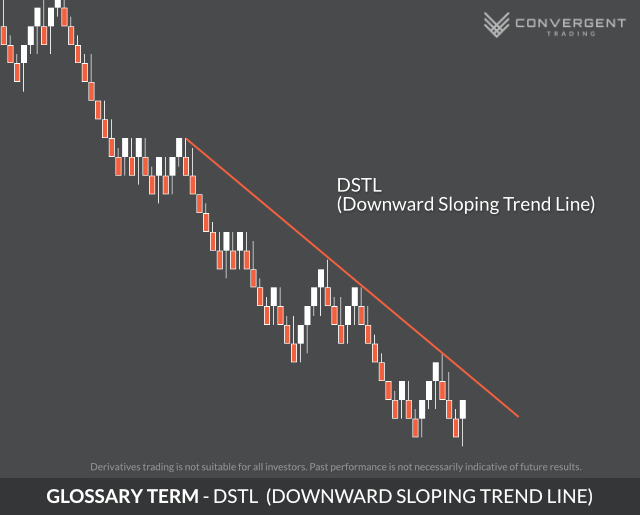
DSTL - Downward Sloping Trend Line
First see Volume Delta below. CumDelta is the sum of all of the Volume Delta values since the start of the session.
E
Expectancy
Expectancy provides the expected outcome of a trading system over a given series of trades. Expectancy can be measured in ticks, dollars, pips, etc.
The formula for expectancy is (Average Win * Winning Percentage) – (Average Loss * Losing Percentage).
Expectancy is used to:
- Measure the performance of a system, setup, or trader over time.
- Assist in setting performance goals.
- Help to determine what part of the system (from the expectancy equation) might need improvement.
Free resource/trial
F
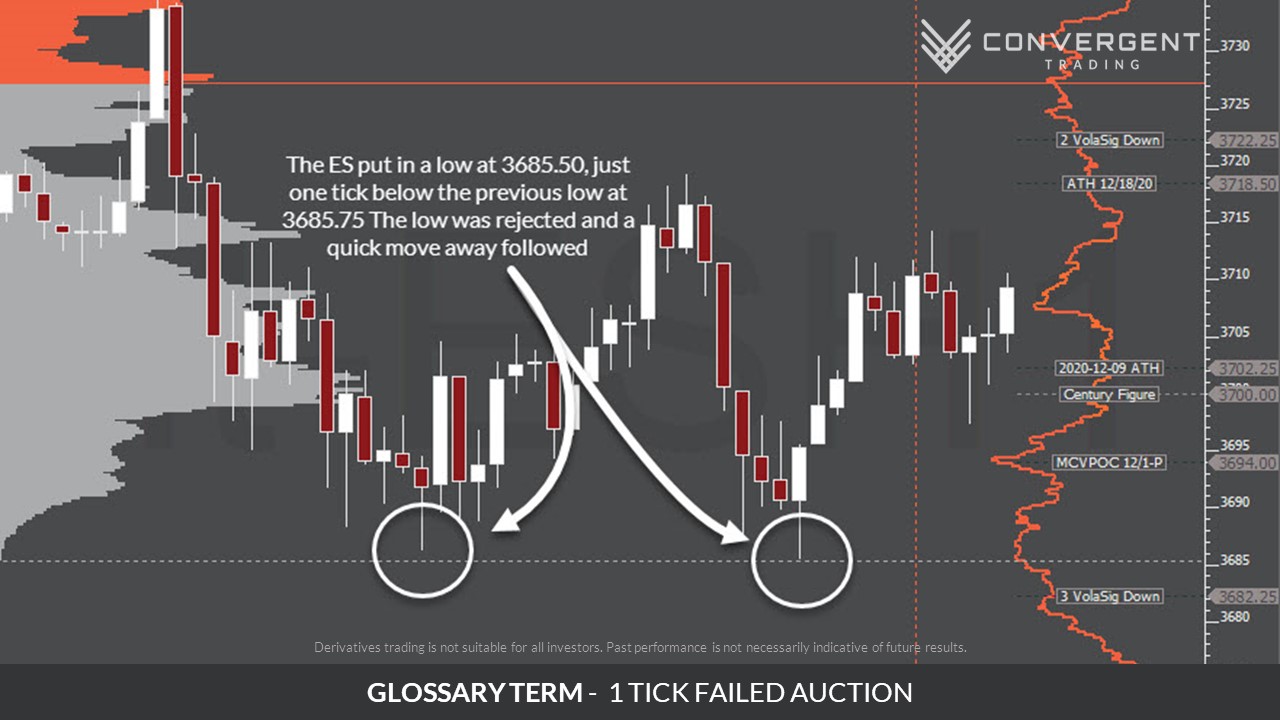
Failed Auction
This is similar to 1-Tick Test described above. It is when the market moves to a significant low or high, 1-ticks it, and then we see a forceful move the other way, usually on strong volume. The market has tested a significant low or high and was unable to trigger continuation. This leaves many trapped, and a push the other way flushes them out.
Flush
Full Session
G
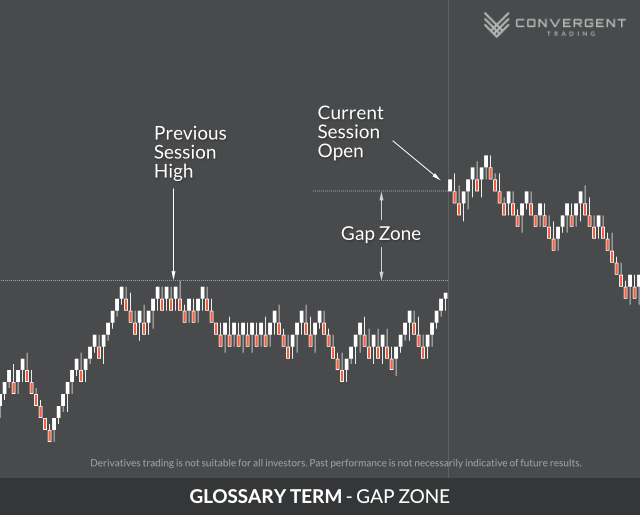
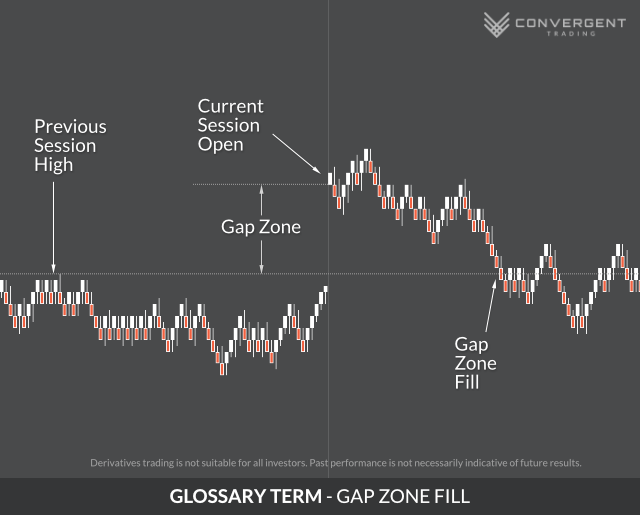
Gap Zone
Gap Zone Fill
A Gap Zone is considered to be ‘closed’ when the market trades back through the unauctioned area and trades the high (for a gap up) or low (for a gap down) of the day prior to the session that first created the gap. A Gap Zone can be closed during the same session in which it was created, the next day, many days later, or not at all.
A Gap Zone Fill may be perceived as significant, as the market has successfully negated the Gap Zone and potentially invalidated the reasons for such a move in the first place. This may be a trigger to force further covering or re-positioning by certain market participants.
Free resource/trial
H
Harmonic Rotation
When viewed within a consistent time frame, a market’s Harmonic Rotation is the size of it’s most common swing. Often this is assessed on a 1 minute periodicity.
By assessing the distribution of market swings across the study period and understanding what is a normal versus what is a larger than normal swing, a trader is better able to understand whether market movements are significant or not. For example, a swing equal to a market’s Harmonic Rotation is not likely to hold very much significance as it is part of its natural back and forth undulations.
The Harmonic Rotation is sometimes utilized by traders in ways such as assisting with entries, setting target and stop losses and assessing the general state of the market.
HVN – High Volume Node
This describes a range of prices where there is a particularly high amount of volume or bulge in the profile. Why is it significant? Think of why it would have so many contracts… why did so many trades execute at these prices? When trading through HVNs or VPOCs, the market tends to be “stuck in the mud,” or my favorite example: prices trade much like a golf ball bouncing in the rough. (See above.) These are high volume nodes. But there are times when you have a bulging portion of the profile that does not have enough contracts traded there to make it a VPOC. This is described as an HVN.
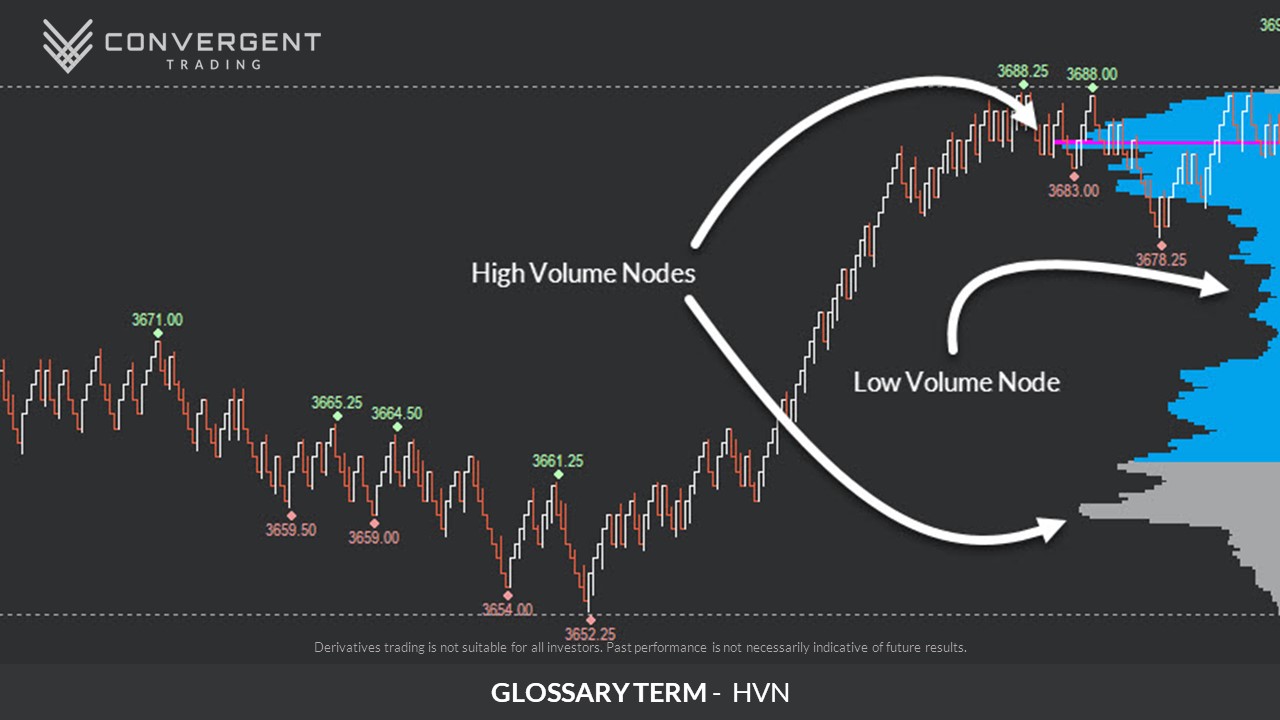
See also LVN – Low Volume Node
Hitting the Bid
Hitting the Bid is when sellers are willing to trade at the next best available Bid price, rather than waiting for a Limit Order to be filled at the current Best Offer price. By being willing to Cross the Market and hit the bid, the participant is considered an Aggressive Participant.
I
Iceberg
Traders and institutions often have large orders to be executed in the market, and placing a large order all at once in the order book could be disadvantageous, as it may reveal their intentions. To assist them with this, the trader or institution can use a hidden, algorithmic type of order known as an Iceberg.
An Iceberg order works by placing a small portion of the entire order in the order book, and once this small portion is executed, quickly adding another small portion. This process is repeated and small amounts of the original order are continuously fed out until either the entirety of the original order has been exhausted, or price moves away from the location. This technique is algorithmic and can be very fast. The process of adding more contracts to the order book is known as Reloading.
Traders can often detect an Iceberg order by observing:
- price not moving
- a higher volume of contracts being executed at a specific level than it would usually take to move the Best Bid/Offer to the next price
- contracts available at a specific price continually being reloaded as orders are being executed
Iceberg levels can often be potential support or resistance areas due to the large volume that was traded.
IB – Initial Balance
The Initial Balance (IB) is a measurement of how far the auction has moved in one direction or another during the first hour after the open. It is defined as the high and low of the first hour of trading. This is the traditional definition you’ll find. However, my perspective is not strictly “traditional.”
I pay attention not only to the high and low of the first hour (usually when the main order flow occurs), but also to how it happens. Is it a straight move downward, like what occurred on this day? Generally, if the price discovery process is fast, as shown in that example, the ES will often go into a wide rotation upward and offer more scalping opportunities. If it grinds slowly down through the range in the same time period, it will likely have very little rotational action and will instead show a steady seller pushing it through the IB low in a choppy fashion.
Information Risk
When a trader chooses to engage at better prices, in exchange for having less information, they take on increased information risk. The trade-off with information risk is that, while you may get a better price, it is often closer to your stop.
See: Price Risk
L
Lifting the Offer
Lifting the Offer is when buyers are willing to trade at the next best available Offer price, rather than waiting for a Limit Order to be filled at the current Best Bid price. By being willing to Cross the Market and Lift the Offer, the participant is considered an Aggressive Participant.
Limit Order
A limit order is an order to buy or sell the market, up to a maximum or down to a minimum price specified.
When a trader places a limit order, the order is placed in the ‘Limit Order Book‘ where generally, there will be other limit orders already queuing. The position in the order queue can have an impact on the ability of traders to have their limit orders filled at the price they have designated.
Limit orders can only be filled when:
- The market price is equal to or better than the specified limit order price
- All of the other orders that are ahead of the trader in the order queue have been successfully executed
- Additional market orders are able to be executed against the limit order
While limit orders are often used for trade entries and targets, how limit orders are used greatly depends on the trader, their motivation and their trading strategy.
See also Order Book and Queue (Order Queue).
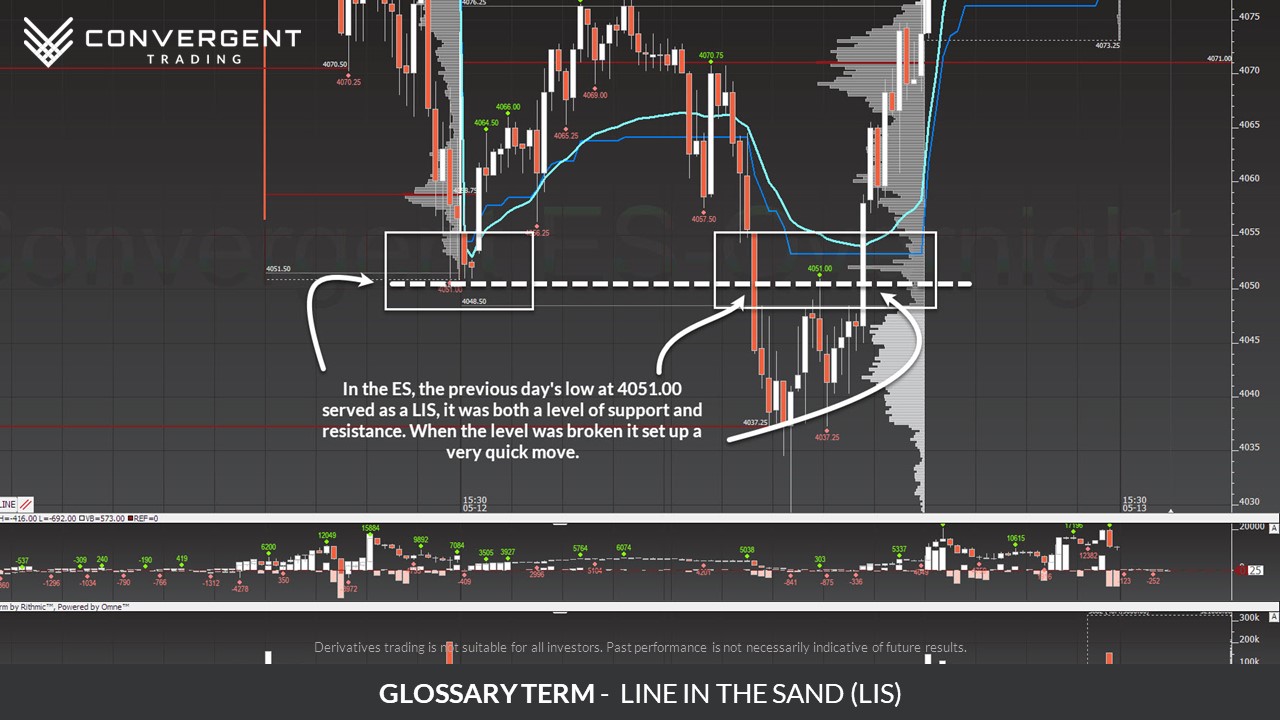
LIS - Line in the Sand
LVN – Low Volume Node

M
Magnet
A Magnet is a significant level or area where the market is likely to return to retest. Magnets include a variety of levels including LVNs, HVNs, Naked VPOCs, Gap Zones, SOCs (Scene of the Crime), etc. Statistics can be created for Magnets and traders can use these levels as part of a setup or trading plan.
MP - Market Profile
Market Profile (also known as Market Profiling) is a technique used by traders to analyze the behavior of financial markets. It is a graphical representation of the price and volume data of a financial instrument over a specific time period. The goal of market profiling is to identify the areas of price equilibrium and imbalance, which can be used to make informed trading decisions. Market Profile charts typically display the distribution of trading volume by price levels and the time spent at each level. This can help traders identify key support and resistance levels, as well as areas of high trading activity. By using Market Profile techniques, traders can gain a better understanding of the underlying market dynamics and potentially identify trading opportunities that may not be immediately apparent through other forms of analysis.
Time Price Opportunities (TPOs) are a component of Market Profile analysis that represent the number of times a price level was touched within a specific time interval.
Market Profile is typically assessed using 30-minute intervals, allowing traders to see the distribution of trading activity over a significant period of time and identify short-term trends and fluctuations.
MAE – Maximum Adverse Excursion
This represents the maximum number of points at which the market moved AGAINST the trade. For example, you enter at 1109.00 short, market moves to 1110.25 before rotating down to 1102.25. MAE = 1.25 pts (notice that it is not 1 pt because you were able to close the trade by lifting 1110.25 for an out of your short trade).
See also MFE – Maximum Favorable Excursion
Measured Move
When the market is trading at undiscovered prices (all-time highs), there aren’t any historical reference levels to help us derive StalkZones. In this case, we’ll utilize a Measured Move. A measured move provides us with an expectation of the “continuation” phase, in the “Impulse–Pullback–Continuation” pattern – this is performed using a Fibonacci Extension tool (available on most platforms) to measure the key swings and project potential areas of interest for the continuation.
In an uptrend, the fib extension tool should be plotted from impulse low to high to pullback low. In a downtrend, the measured move would be plotted from impulse high to low to pullback high – although we will rarely utilize a measured move to the downside because presumably there are historical reference points below that provide better context of the auction.
Head Traders at CT are typically using the 132.8%, 150%, 161.8%, and 200% extensions as potential key levels.
MFE – Maximum Favorable Excursion
This represents the maximum number of points at which the trade could have been closed for a profit. MFE is the farthest the market has gone in favor of the given trade. For example, you enter at 1109.00 short, market moves to 1102.25. MFE = 6.5 pts (notice that it is not 6.75 because you were not likely to close the trade at the very low print).
See also MAE – Maximum Adverse Excursion
MC - Micro-composite
This represents a profile built using several bars in a balanced range within the composite chart. Essentially, what we are trying to do here is find out what is going on inside a balanced set of daily bars.
See MCVPOC – Micro-Composite Volume Point of Control just below for an image of what it looks like.
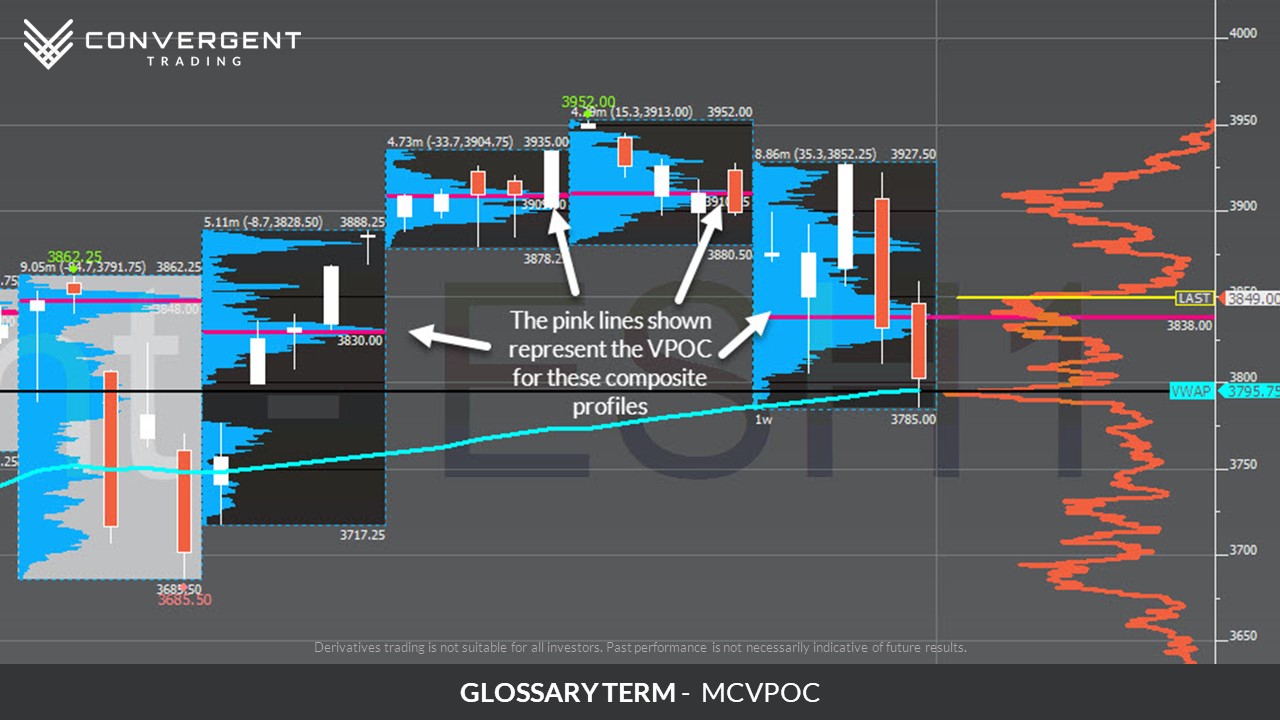
MCVPOC – Micro-composite Volume Point of Control
This is the same as a VPOC addressed below but it refers to the VPOC of a Micro-Composite (MC – Micro-Composite). It shows the most accepted price of a balance range within the Composite Profile.
MOO - Market on Open Orders
Market on Open Orders (MOO) are orders that are submitted by longer timeframe participants prior to the opening of the RTH session. The orders are filled at the market price as soon as the RTH session opens.
MOO orders can push the market in one direction after the open and help to create the initial leg of the Opening Swing.
See also MOC – Market On Close Orders
MOC - Market on Close Orders
Market on Close Orders (MOC) are orders to be executed at the close or just after the close of the RTH session at the market price. These types of orders are generally used by longer time frame participants who want to ensure that their order is executed for that day, and that their execution price is as close to the closing price as possible.
MOC orders can contribute to elevated trading activity during the closing period of a session.
See also MOO – Market On Open Orders
N
Naked Close
Naked Close Retest
A Naked Close Retest occurs when the market returns to test a Naked Close price in the next session or sometime in the future. This retest can indicate that a continuation in the direction of the Naked Close may occur.
See also Naked Close.
Normal Variation (Day Type)
This day type describes a rotational push outside of one side’s Initial Balance (IB) but only slightly. This is the most common day type, accounting for 52.6% of days.
See also Initial Balance.
Non-trend (Day Type)
This day type is a failure to break either side of the Initial Balance (IB), a very narrow/low range. This type of day typically occurs on Holiday Trading, and represents 3.1% of sessions historically.
See also Initial Balance.
Normal (Day Type)
Despite being called “normal” this day type represents a small percentage of days at just 4.1%. A Normal day type has a small one-sided Initial Balance break with a low overall range.
See also Initial Balance.
Neutral (Day Type)
Both the Initial Balance (IB) high and low are broken and market finished inside or near the Initial Balance. This day type has occurred historically 15.8% of sessions.
See also Initial Balance.
Neutral Extreme (Day Type)
Neutral Extreme is a neutral day that after testing 1 side’s IB resulted in a trend being established the other direction and the market closes in the extreme quartile of the range. Historical probability of occurrence is 10.5%
See also Initial Balance.
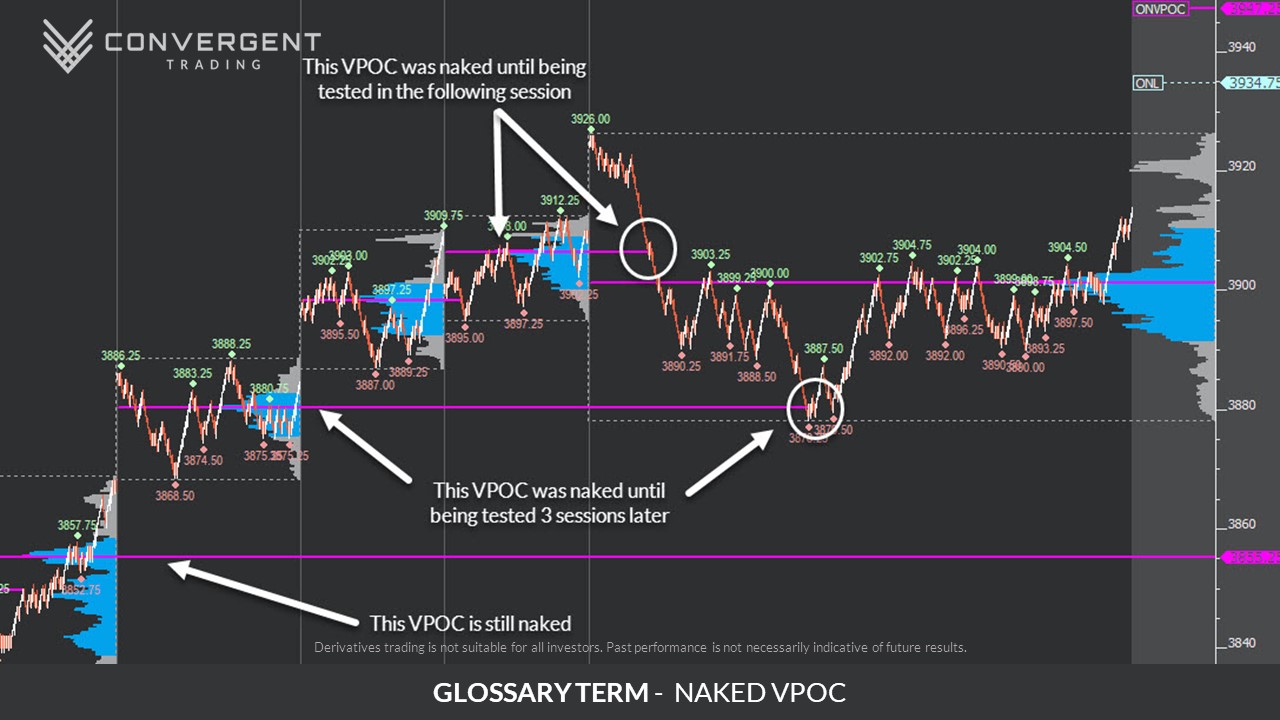
NVPOC - Naked or Virgin Vpoc
A Naked or Virgin VPOC is the same as VPOC described below, except that it has not been touched in the ensuing sessions and, therefore, remains “naked” or “virgin”. The significance of a Naked or Virgin VPOC is that this is the price that saw the most acceptance by both buyers and sellers, but the market has not gone back to see if this still represents value. Naked or Virgin VPOCs act just like price gaps in many ways.
Here is an example of one:
Numbers Bars
Free resource/trial
O
ONHi/ONLo – Overnight High or Overnight Low
This describes the overnight Globex session which takes place after 3:15 PM CT of the previous day up until 8:29:59 AM CT of the current day. I include the last 15 minutes after cash closes as part of the Regular Trading Hours (RTH) session simply because OTC transactions on equities and futures continue to come in at that time, so it provides valid price and volume data.
The high of the overnight session is abbreviated to ONHi and the low of the overnight session is abbreviated to ONLo.
OSH/OSL – Opening Swing High or Opening Swing Low
This is a high and low that is set by the initial auction right after the market opens. It is independent of time and is not the same as an opening range. The opening swing is basically the high of the first push up and the low of the first push down. It measures how far the Market On Open (MOO) orders took the auction right after the open.
OSH stands for Opening Swing High and OSL stands for Opening Swing Low.
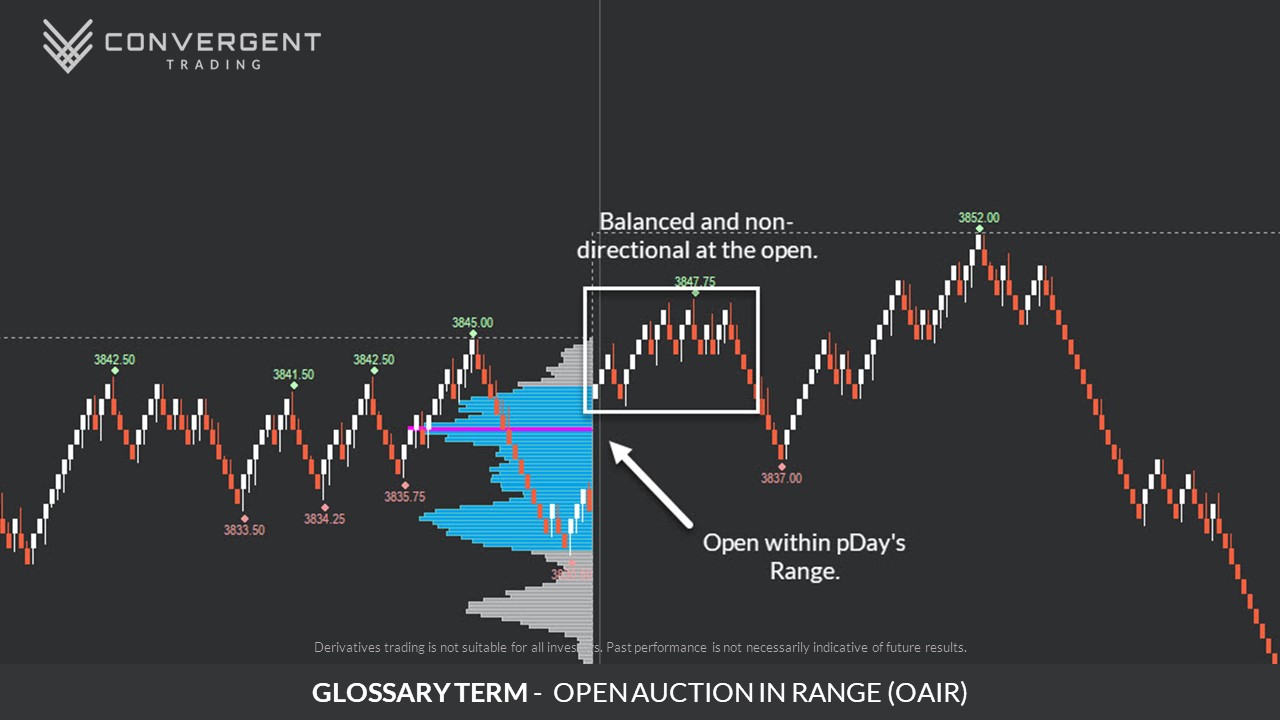
OAIR – Open Auction in-range (Opening Type)
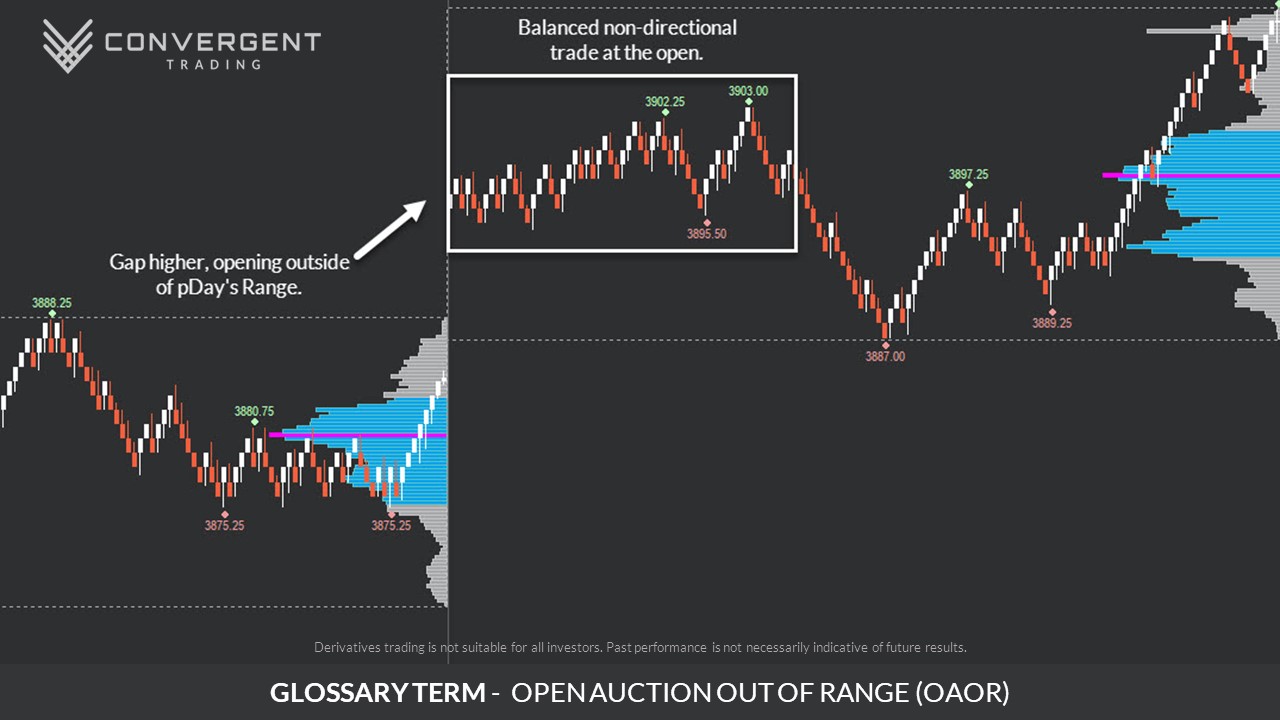
OAOR – Open Auction Out-of-range (Opening Type)
Market opens outside of the previously traded range. There is a high probability of OTF action and these can be BIG days. There will be a higher level of conviction by responsive as well as initiative buyers or sellers.
OD – Open Drive (Opening Type)
If the market opens above or below the prior day’s range or value area, then an Open Drive is dominated by responsive buying back to prior accepted value. If the market moves away from the prior day’s range, then the open is dominated by initiative buying or selling. You want to detect this early and not trade against it. OTF is highly active and is accumulating or distributing aggressively.
Offer
An Offer is an order to sell from Passive Participants. These are orders that are waiting to be filled and could be withdrawn at any time.
Order Book (Limit Order Book)
The Order Book or Limit Order Book is the list of limit orders that have been submitted to the exchange to be executed at various price levels.
The Order Book can be represented as volume bars in a DOM or as bands of color in heat map software such as CT Bookmap.
Traders sometimes use the Order Book to help them make trading decisions by observing where other traders add or remove liquidity, and noting how the market interacts with the liquidity when it reaches those price levels.
See also Queue, Spoofing, DOM – Depth of Market.
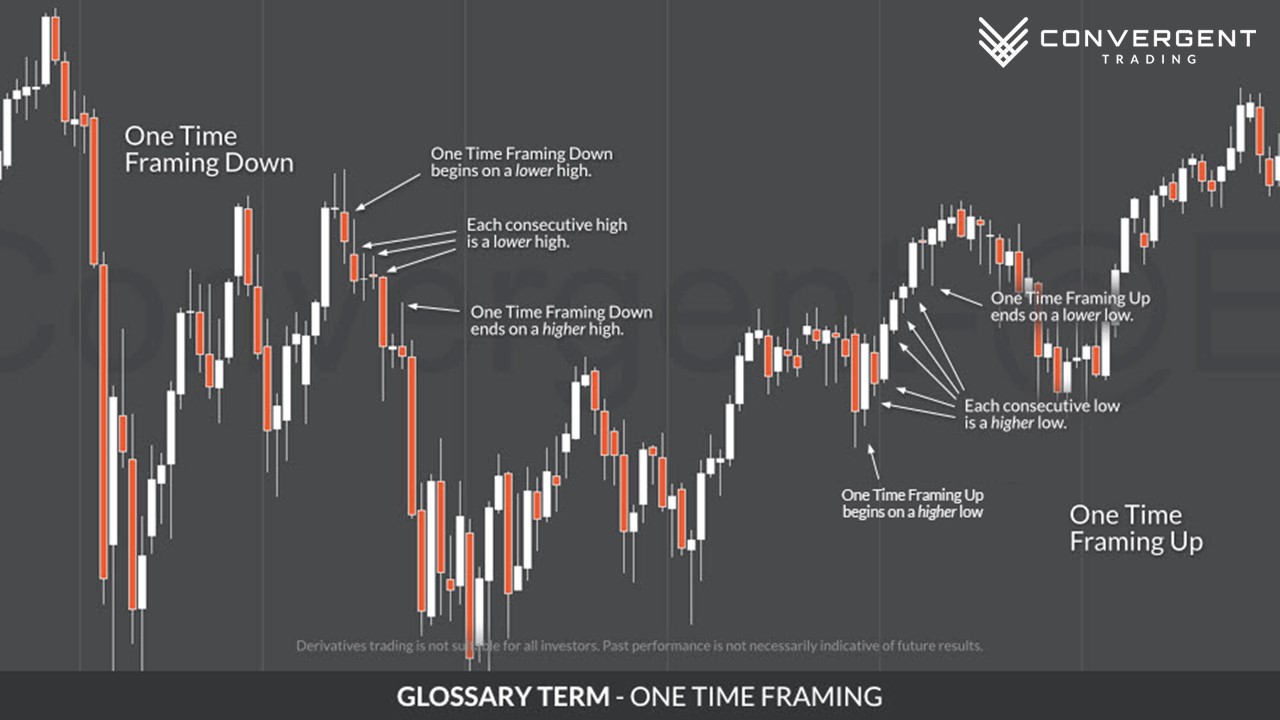
One Time Framing or 1-TFING
One Time Framing is a way to describe how the auction is performing over 2 or more bars. One Time Framing can help to provide an indication of which side is in control.
One Time Framing Up indicates that the low of each bar is higher than the low of the bar directly preceding it (higher lows). There doesn’t have to be a higher high for this to be valid. One Time Framing Down indicates that the high each bar is lower than the high of the bar directly preceding it (lower highs). There doesn’t have to be a lower low for this to be valid.
Once the pattern of higher lows or lower highs has been broken, One Time Framing is considered to have ceased. The concept of One Time Framing can be applied to bars of any type of periodicity, but is traditionally used when referring to Weekly, Daily or 30 Minute bars.
ORR – Open Rejection Reverse (Opening Type)
Market attempts to continue in a prior direction and is met with fierce opposition, and off to the races it goes. This is like an Open Drive, but it has gone to an area that did not meet with acceptance. OTF has found an area of conviction to participate in the opposite direction.
OTD – Open Test Drive (Opening Type)
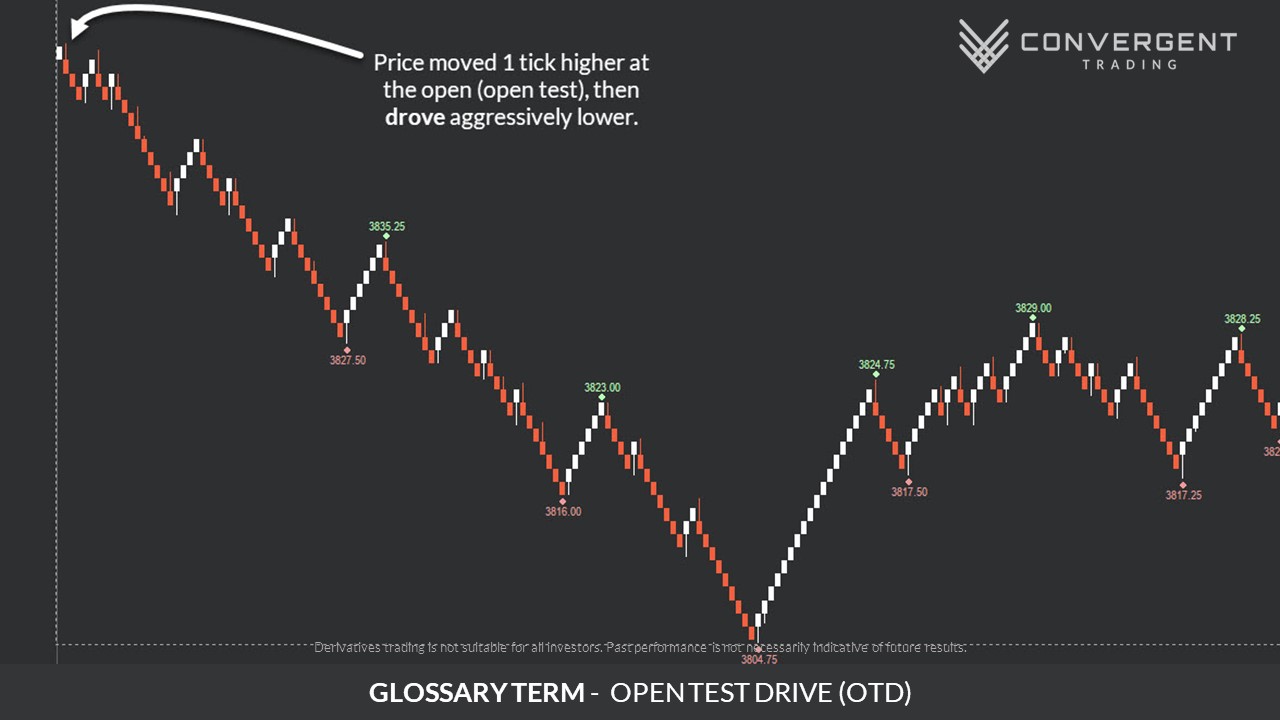
Market opens, moves a short distance in one direction and then another, trying to advertise for one side or the other to step in. This will usually test a prior key area and then push once it has gained conviction that nobody is left to oppose it. OTF waited for a test and has stepped in to execute in a fixed direction.
OTF – Other Time Frame (Buyer or Seller)
Over/under Stalkzone
Overnight Inventory
P
Passive Participants
Passive Participants are traders who have placed a Bid or Offer Limit Order in the market, and are content to wait for these orders to be filled at the price they have pre-selected. Passive Participants can withdraw these orders at any time prior to being filled.
See also Aggressive Participants.
Price Risk
When a trader opts to wait for more information, in lieu of better prices, they have increased Price Risk. The trade-off here is that although prices are potentially slightly worse, we expect the extra information to provide us with more confidence in the decision.
See also Info Risk.
Q
Quad or Quadruple Witching Friday
Stock index futures, stock options, stock index options and single stock futures (SSF’s) all expire on the 3rd Friday of March, June, September and December. This day is referred to as Quad or Quadruple Witching Friday.
Derivative traders will be more active during this time due to the combined effects of exercise, delivery, hedging, arbitrage as well as speculative options trading and futures trading activity during quad-witching. Generally, there is a 50-70% increase in volume leading up to this day. Although the overall action doesn’t look like other days, underneath the surface, there is a lot of trading occurring to hedge delta and to attempt to pin prices in order to generate or hedge returns.
Queue (Order Queue)
When a trader places a Limit Order on the exchange, the order is placed into the Limit Order Book in the sequence that they are received by the exchange. The position in the order book is known as the ‘order in the queue’ or ‘Time Rank’.
The Limit Order may be filled in a different sequence than its place in the queue. The sequence that an order is filled is dependent on the exchange, the instrument being traded, and the matching algorithm that is used to fill the orders.
A contract such as the S&P 500 e-mini (ES) or Light Sweet Crude Oil WTI (CL) is filled in a ‘First In – First Out’ algorithm, meaning that the orders are executed in the order that they are received. Consult the contract specifications for your futures contract on the exchange on which your instrument is being traded.
A general description of the different order algorithms can be found at the following links:
CME – https://www.cmegroup.com/education/matching-algorithm-overview.html
Eurex – https://www.eurexchange.com/resource/blob/336474/a46fee28332aa0013a3b4cfb102ee237/data/tc_history_14091999_en.pdf.pdf
While it varies between futures contracts, it is important to remember that changes to the original order most often result in the order being placed at the back of the queue.
R
Range Extension
RTH – Regular Trading Hours
RRAN - Relative Range
RVOL - Relative Volume
Reloading
Reloading is the adding of orders to the order book and may be in the context of an Iceberg. Reloading is generally referred to when a market is moving directionally and an Aggressive Participant is Crossing the Market. As they execute, additional Limit Orders “reload” at the same price.
See also Iceberg.
S
SOC - Scene of the Crime
“Scale at 10XX.XX”
Scaling is simply the process of taking profits or reducing risk on a trade. Once I have entered the market, I take partial profits to reduce risk and to hedge against an unforeseen counter-movement that might take place at any time. An example of a scale-out scheme tweeted in real time is posted here: Anatomy of a Scaling Trade. I scale into trades in very important zones to do business. In those situations, I will say “scaled in” or “added at 10XX.XX”.
Spike
A Spike is a swift market move that quickly traverses several price levels.
Spikes are caused by Aggressive Participants who are eager to have their orders quickly executed at the best available market price. Spikes occur when Market Orders, often as stop orders, overwhelm the available liquidity in the Order Book. Price moves quickly through several levels before the Market Orders are exhausted and the opposing participant aggressively seizes upon the opportunity to execute at what they perceive to be advantageous prices, bringing the market back to where the move began.
Spikes may be a sign of elevated probability for some kind of reversal in price. They can be observed in all markets and time frames, but their size and impact will vary depending on instrument, liquidity, participants involved, etc.
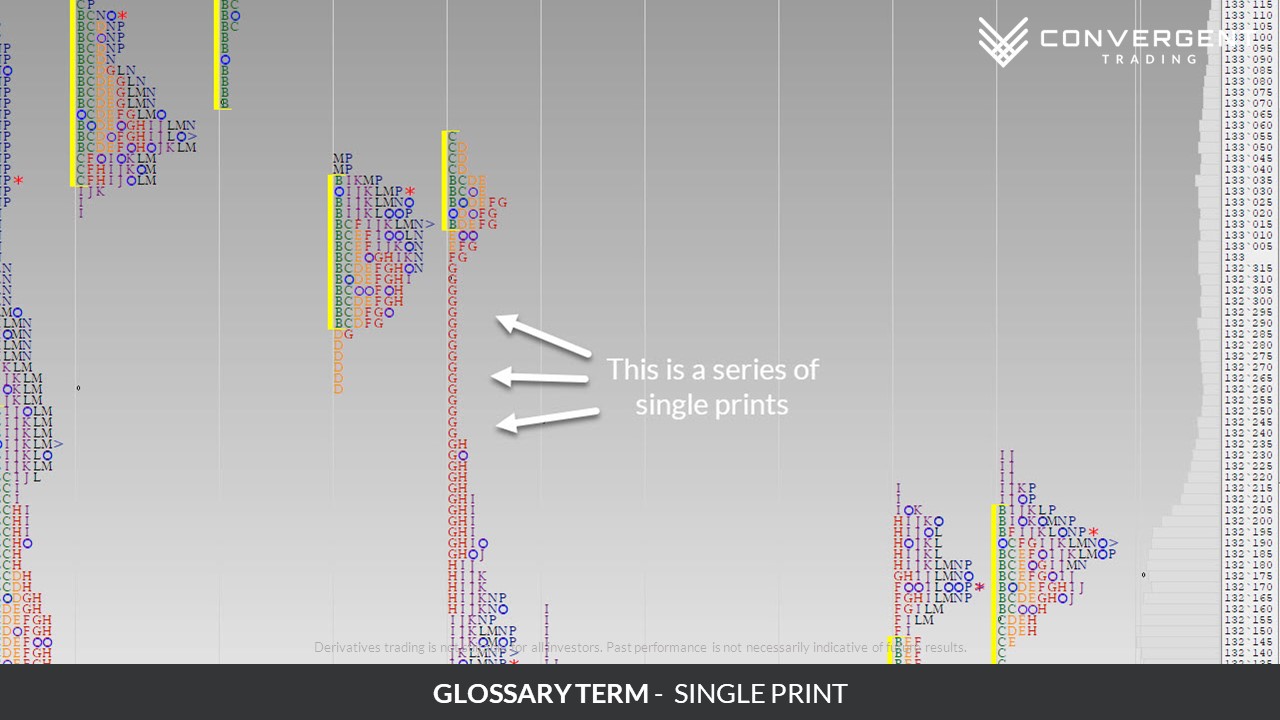
Single Print
“Single Print” is a Market Profile term describing a concept where just a single letter or TPO (Time Price Opportunity) is printed, and other subsequent periods do not overlap the single print.
On a standard Market Profile chart, each letter represents a 30 minute period. Single prints indicate that no subsequent 30 minute period traded the price levels during that session.
A single print could indicate an excess high or low, as well as an area of low volume and lack of price acceptance (imbalance).
Spoof / Spoofer / Spoofing
A Spoof order is one that is placed in the market, where the trader has no intention of having the order filled.
Spoof orders are placed in an attempt to manipulate other market participants into believing that there is more liquidity at a specific price or prices than what is really available. The Spoofer will allow price to get close to their orders, but prior to the market reaching this level, the Spoofer will quickly withdraw the orders and the liquidity will disappear from the Order Book.
Spoofing was made illegal in 2010 as part of the 2010 Dodd-Frank Wall Street Reform and Consumer Protection Act, but evidence of the practice can still be seen in order flow tools such as Bookmap (order flow heatmap) or in a DOM. Traders still might be able to spot behavior that may be related to Spoofing by looking for high levels of liquidity that quickly disappear once price approaches them.
Because the Spoofed orders that have been submitted are real, Spoofers risk having their orders filled if they are unable to withdraw the orders fast enough as the market approaches.
StalkZone™ Levels
StalkZone™ levels are daily-updated trade decision zones where market engagement is expected to take place. It doesn’t necessarily mean that a trade will be taken in this area, but it is pre-defined based on Volume Profile, Price Action, prior Order Flow, and statistical expectancies. These are proprietary zones and are available to community members.
Stop Run
If there is a key support or resistance level nearby, traders often place their stop loss orders in very similar locations behind the level, in order to control their risk. When there is a concentration of stop orders in these areas, if stop orders are triggered they can create a cascading effect that causes the market to move very swiftly through several prices.
When the market reaches a key support or resistance level, it may be obvious that a cluster of stop orders is waiting to be triggered. Certain participants may trade in an attempt to push prices beyond the level so that the stop orders are triggered and they might profit from the short-term price movement that ensues. This is known as a Stop Run.
The extent of the Stop Run will depend upon several factors, including the instrument being traded, the time of day, the traders participating at that time, the depth of the Order Book, etc.
Free resource/trial
T
THEO AVG – Theoretical Average Price of Unit (TA)
Template Day
The term Template Day refers to the most recent previously traded session that over laps with the price levels or projected price levels of today’s session.
This previous session is used to help us make an informed hypothesis as to where key inflection points in the market may be today, based on the least and most accepted price levels from that previous session.
Trend (Day Type)
Trend Days typically occur after a balanced day or a balanced open to the session. Directional movement with small counter rotations. Extended to or beyond 2X the Initial Balance range. Historical probability of 13.9%
See also Initial Balance.
U
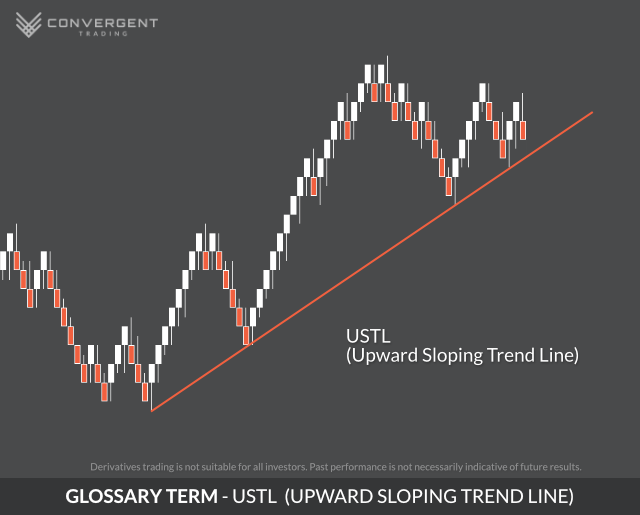
USTL - Upward Sloping Trend Line
V
Velocity (Trade or Print)
Vola Sig
Vola Sigma is shorthand for Volatility Sigma. It’s a way of describing how much volatility (or price movement) is expected to vary, typically in the context of options trading, and it is based on close-to-close volatility. Volatility refers to the rate at which the price of an asset (like a stock, futures, or options) is expected to fluctuate. It’s often measured as implied volatility (IV) in the context of options.
Sigma is a statistical term for standard deviation, which measures the dispersion or spread of a set of data points. In the context of trading, it tells you how much the implied volatility (or price movement) can vary from the average expected movement.
For example, 1-Vola Sigma represents one standard deviation move in implied volatility.
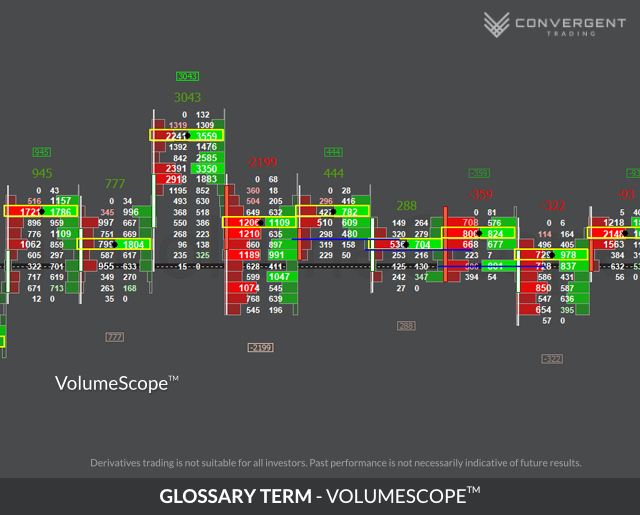
VolumeScope™
VolumeScope™ (also Footprint or Numbers Bars) is a type of chart that displays the bid/ask traded volume at each price, on bars of any periodicity. This type of chart usually has various options for coloring, scaling and profiling to help a trader see what is happening within each bar as if it were “under a microscope”.
VolumeScope™ can help provide insights into participation at key price levels and is a key tool for those who pay close attention to Order Flow as a way to initiate trades.
VoR – Volume on Rotation
VPOC – Volume Point of Control
The Volume Point of Control (VPOC) in Market Profile terms stands for the most commonly traded price closest to the center of the range. Since I am not interested in old-school market profile letter-based measurement of trading activity (see here for an example), I only focus on volume-based profile. Significance of VPOC is that this is the price that saw the most acceptance by both buyers and sellers (for every buyer, there is a seller). The market has priced in all known variables and finds this price to be the most favorable to get in and out of the instrument traded.
W
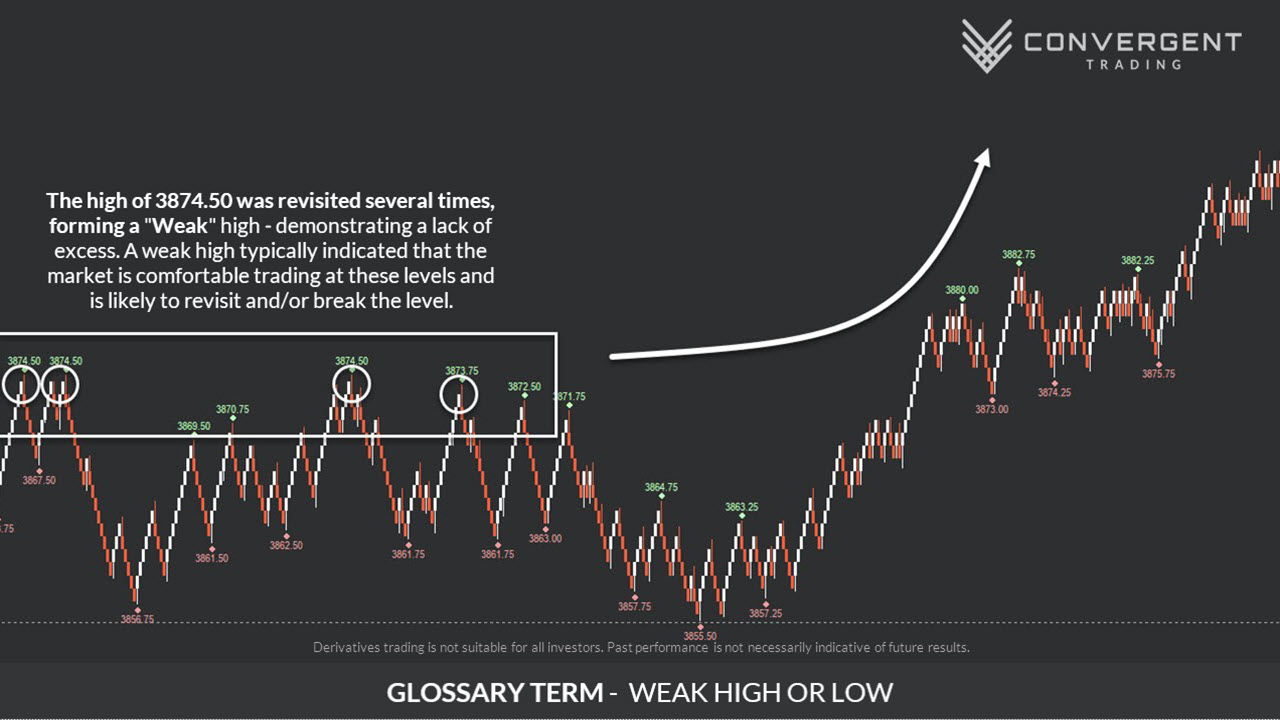
Weak High or Low
It is easiest to illustrate what a Weak Low by discussing what a Strong or Excess Low is. When the market moves lower and finds that prices are just too low to be fair, the traders generally immediately drive price higher as buyers grab up as many contracts as possible at the perceived low prices. This generally leaves a buying tail on the chart and little in the way of volume on the profile.
A Weak Low is the opposite. This occurs when the market tests a low and can’t move away from it readily. A lot of volume trades a tick or so from the low print and buyers don’t seem to be interested in lifting prices higher. This is a weak low and there is generally a tendency to revisit that low within that session or immediately after that session. Here is an example:
“Working 1098.50”
Z
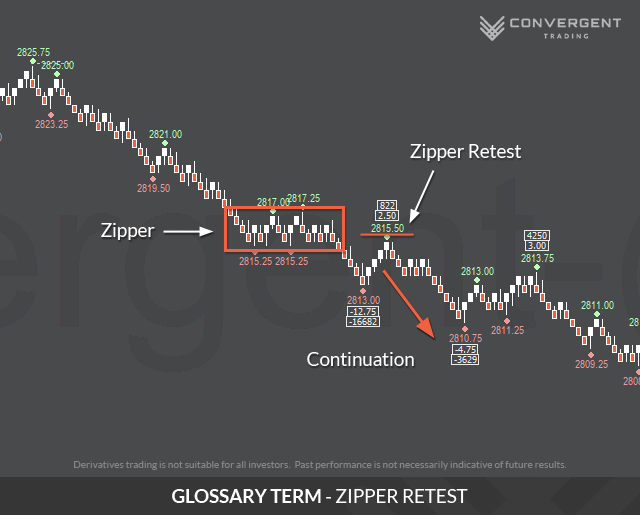
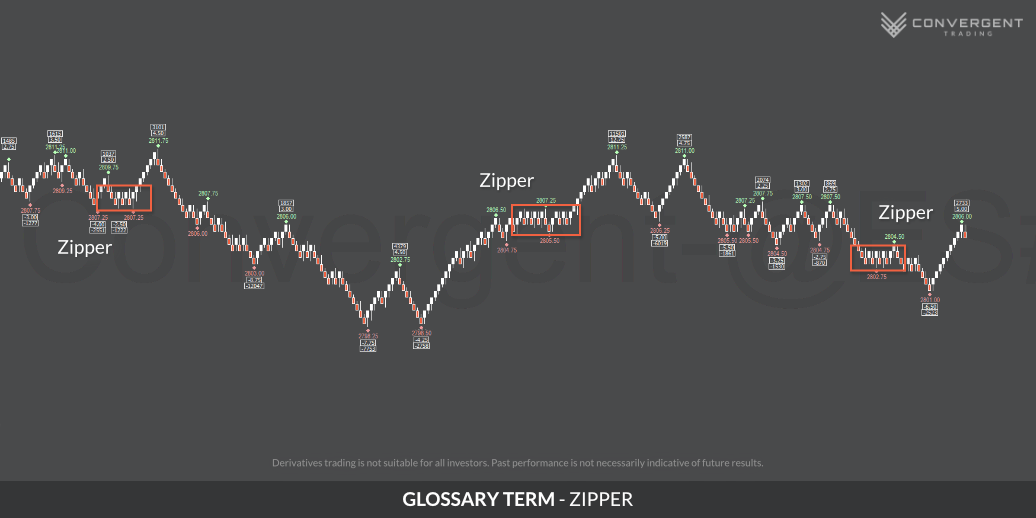
Zipper
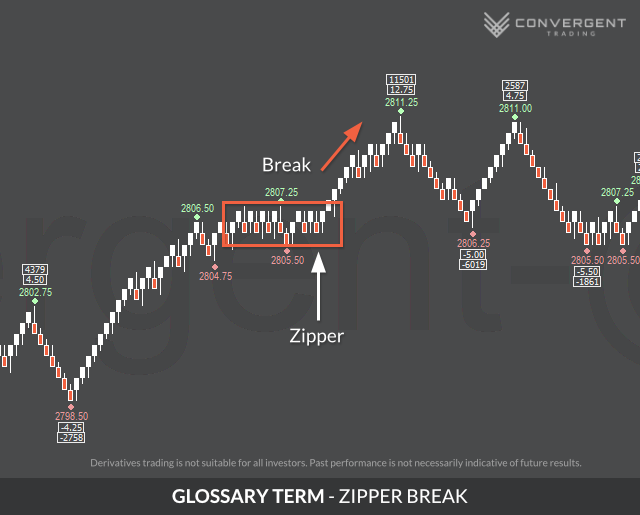
Zipper Break
Zipper Retest