Sunday, December 17th @ 8:49 AM CST
Most traders are in constant pursuit of the latest and greatest trade setup. However, many lack the foundational market context and framework to understand when and where these setups should be applied. In this article, we’ll explore a basic entry model for structured pullback trades, simplifying what can often seem like a complex decision. This approach is particularly relevant for situations where the market exhibits an impulsive move on a higher timeframe, followed by a pullback into an area of interest, with the objective to find an entry point on a lower timeframe – to capitalize on that over-arching trend.
One such example of this could be that the market has made an new Regular Trading Hours (RTH) high after breaking the Initial Balance (IB) high, and you are interested in the first pullback to Day Generated Prices (DGPs), let’s take a look:
The Higher Timeframe Foundation

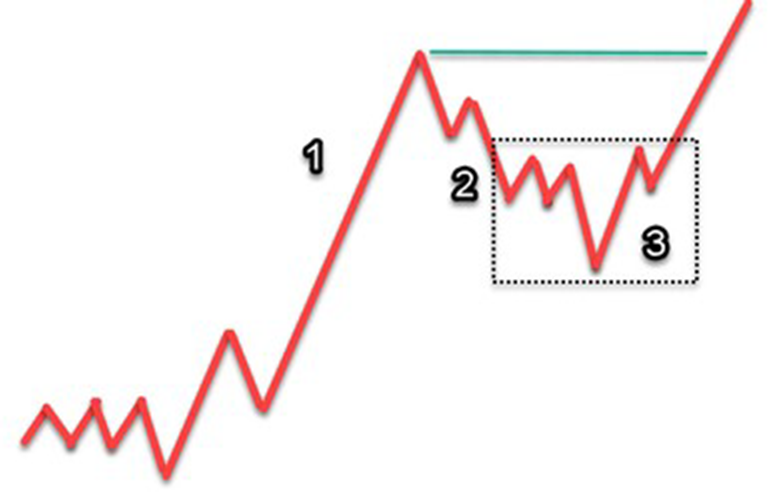
Image 1 illustrates a typical structured pullback on a higher timeframe: the number ‘1’ marks the initial impulsive move, ‘2’ denotes the subsequent retracement, and ‘3’ —outlined by the dotted box—indicates the potential entry zone aligned with our pre-defined area of interest. For this setup, the primary target is a retest of the impulse peak — the green line — and our stop-loss would be just beneath the pullback’s lowest point.

Identifying the Setup
In image 2, we zero in on the entry model. You might have identified the impulse structure (image 1) on 60, 30, or 15 minute chart for example. So you may be looking for this entry model on a 5-minute or 1-minute chart, or perhaps you’re using a P&F, Renko, or Footprint Chart. The key point here is that you are identifying the structure on a higher timeframe, and triggering the setup with a slightly more zoomed in lens.
- Box 1: Auctioning Pullback. The market exhibits a downtrend, characterized by lower lows and brief rallies, before reaching new support levels. A common mistake newer traders make is not recognizing this condition of price auctioning lower, and entering too soon.
- Box 2: Key Support Zipper. This zipper represents a significant yet fragile support level, often the last stand before a new low. Traders observing order flow might notice an influx of early long positions here, attempting to establish support. Caution is advised, as this is probably the area where many of you mistakenly enter.
- Box 3: Stop Run and Capitulation. This is where those early, aggressive longs, and any other weak hands get shaken out, and price gives a flush lower, pauses briefly, then returns to the zipper (box 2).
- Box 4: Indication of Reversal. It’s important that the market makes a higher high than the high of that zipper (box 2). Achieving this higher high is key. It signifies a shift from the prevailing downtrend to potentially reversing to auction higher.
- Box 5: The Test. Following a higher high (box 4), we expect a pullback to either confirm or deny the shift in market structure. When the test occurs: does the price maintain above the 50% level between the capitulation low and the new high? This point, marked by a green dotted line in image 2, serves as a key indicator. If the price holds above this mid-point, it confirms the market’s upward shift.
- Box 6: Confirmation of Continuation. Here, the price rebounds from the pullback, momentarily stabilizes at the previous high (zippering), and then proceeds upward (zipper break). This behavior confirms the shift from short-term pullback to resuming the higher timeframe uptrend.
If you would like to learn more about the market analysis techniques and key terms discussed in this blog post, then you’ll definitely find value in the Trade Right Program. The program is included with all quarterly and annual CT memberships. At the end of this article, you’ll find a special offer on our quarterly membership plan!
Entry Strategies
How one uses this model to enter a trade is dependent on each individual trader. There are three primary entry points, each varying in risk and timing.
- The first, entering at the capitulation low (box 3), is the most aggressive and highest risk. It requires identifying the key zipper (box 2), anticipating the stop run, and estimating the lowest point of capitulation. This entry point is typically less favored due to the limited evidence of a shift in market structure at this stage.
- The second entry point is at the pullback from the first higher high (box 5): This approach is generally the most widely used among traders. Entering the trade during the pullback phase following the first higher high, provides balance of more confirmation of the trend change while still maintaining a reasonable risk-reward ratio (R-Factor).
- The third entry point at the breakout through the new high (box 6). In some cases, when the market is moving aggressively, this entry is only option. When the market strongly holds after capitulation, it may demonstrate little to no sign of a pullback. In the right circumstances, this can be a higher probability entry. However, traders must be cautious and skilled in identifying the right market context for this entry choice, as it can sometimes result in false breakout signals.
With all entry options, the idea stop-loss would be below the capitulation low (box 3). In some cases, it may be appropriate for it to be moved below the pullback low, but obviously there is risk of being shaken out.
Key Points
- Understanding Market Conditions: Recognizing the pattern of impulsive moves and pullbacks on higher timeframes is crucial for identifying entry points on lower timeframes.
- Entry Points: We discussed three primary entry strategies – entering at the capitulation low, during the pullback from the first higher high, and at the breakout through the new high, each varying in risk, reward, and timing.
- Recognizing Market Phases: Understanding the transition from a pullback phase to potential trend continuation, as indicated by specific market behaviors and patterns.
- Avoiding Common Mistakes: Emphasizing the importance of proper timing and the areas where traders commonly execute premature entries.
- Risk Management: Highlighting the key target, stop loss point, and how the various entry points may increase or decrease risk-reward ratios (R-Factor).
If you are a Convergent Trading member, join me for the upcoming Member Study Hall session where I will outline this setup step-by-step with real-world market examples and answer your questions live!
– John471 (ES Market Maven at Convergent Trading)
This blog post has guided you through a structured approach to trading pullbacks. Offering insights into market conditions, auction patterns, trade premise, entry points, and risk management. These concepts, crucial for any trader, are the key components of our Trade Right Program. This program is designed to enhance your understanding and application of these concepts to your individual trading plan. Take the opportunity to deepen your trading knowledge and become more disciplined in your approach by joining a community that shares your commitment to excellence in trading.
Comments
Submit a Comment
popular articles


Join convergent today
Becoming a Convergent Trader isn't about buying a course. It's about transforming who you are as a trader.
Join today
Appreciate you putting this out there. I keep referring back to this to make sure I understand and can eventually apply with better reaction,
We’re glad you are getting good use of it.